Link to code (control and demo): http://www.filefactory.com/file/ah13e8g/n/VisualTimelineDemo_zip
Link to demo: http://silverlight.services.live.com/invoke/105917/TimeLine%20Visualizer%20Demo/iframe.html
TimeLineVisualizer xaml:
    <Grid x:Name="LayoutRoot" Background="White">
<Grid.RowDefinitions>
    <RowDefinition x:Name="TimeLineAxisRow" Height="Auto"/>
    <RowDefinition x:Name="TimeLineObjectsRow" Height="*"/>
Grid.RowDefinitions>
<Canvas Name="AxisCanvas" Grid.Row="0" Height="50" Margin="0,0,20,0">
    <Line Name="AxisLine" Stroke="#AA000000" StrokeThickness=".2" Canvas.Top="48" Canvas.Left="0"/>
Canvas>
<ScrollViewer Name="PlotScrollViewer" BorderThickness="0" Margin="0" Padding="0" Grid.Row="1" SizeChanged="ScrollViewer_SizeChanged">
    <Canvas Name="PlotCanvas" SizeChanged="Canvas_SizeChanged" MouseLeftButtonDown="Canvas_MouseLeftButtonDown" MouseLeftButtonUp="Canvas_MouseLeftButtonUp" MouseMove="Canvas_MouseMove" >
        <Canvas.Background>
            <LinearGradientBrush EndPoint="0.457,0.296" StartPoint="0.459,1.296">
                <GradientStop Color="#FFCBCBCB"/>
                <GradientStop Color="#FFFFFFFF" Offset="1.1"/>
            LinearGradientBrush>
        Canvas.Background>
    Canvas>
ScrollViewer>
Grid>
TimeLineVisualizer takes the data in the form of IEnumerable<timelinedata>:
    public class TimeLineData : INotifyPropertyChanged

{

private bool _IsHighLighted;


public Brush BackGround { get; set; }

public object DataContext { get; set; }

public DateTime Start { get; set; }

public DateTime End { get; set; }

public string Label { get; set; }

public object ToolTip { get; set; }

public bool IsHighlighted

{

    get { return _IsHighLighted; }

    set

    {

        _IsHighLighted = value;

        if (PropertyChanged != null)

            PropertyChanged(this, new PropertyChangedEventArgs("IsHighLighted"));

    }

}


#region INotifyPropertyChanged Members


public event PropertyChangedEventHandler PropertyChanged;


#endregion

}
When you set the ITemsSource for the visualizer, you should be able to massage any data into this form using LINQ, if the data has a schedule-like behavior. There is a DataContext property to hang any app-specific data on the timeline object. This will get included in the DetailRequested event if the timeline is selected at the time.
Xaml for TimeLine:
    <Canvas Name="RootCanvas" SizeChanged="Canvas_SizeChanged" MouseLeftButtonDown="Canvas_MouseLeftButtonDown" >

        <Border Name="TimeLineBorder" CornerRadius="5" BorderBrush="#BB64789B"

        BorderThickness="1" Canvas.Top="0" MouseLeftButtonDown="Border_MouseLeftButtonDown" Background="{StaticResource TimeLineBackground}">

        </Border>

        <TextBlock FontWeight="Medium"  MouseLeftButtonDown="Border_MouseLeftButtonDown" FontSize="10" Name="TimeLineTextBlock" HorizontalAlignment="Center" VerticalAlignment="Center">

        </TextBlock>

        <Line Name="BottomBorderLine" Stroke="#FFFFFFFF" StrokeThickness=".1"/>

        </Canvas>
The visualizer just presents the data in the same order as it receives, so user OrderBy if you want to see data in a sequential format top to bottom. For each TimeLineData object, the Visualizer control creates a TimeLine control, and stack them top to bottom in the canvas PlotCanvas.
        private void VisualizeItemsSource()

       {

//we may change the size of the plot depending on number of elements we have to draw.

//Dont want to fire the size-changed event and redraw stuff, so unhook event handler

       PlotCanvas.SizeChanged -= Canvas_SizeChanged;

       String[] currHighlight = null;

       if (PlotCanvas.Children.Count > 0)

       {

       currHighlight = (from tl in PlotCanvas.Children

           where

           tl is TimeLine && ((TimeLine)tl).ItemsSource.IsHighlighted

           select ((TimeLine)tl).ItemsSource.Label).ToArray();

       }

//remove all existing stuff on the plot canvas

       PlotCanvas.Children.Clear();

//if the elements can be more than the minimum specified height and still fit into the

//viewport of scrollviewer, do that. Else grow the plotcanvas height to (elementCount * minimumHeight)

       PlotCanvas.Height = PlotScrollViewer.ActualHeight;

       double totalHeight = PlotCanvas.Height;

       double tlHeight = 0;

       if (_itemsSource != null)

       {

       tlHeight = totalHeight/_itemsSource.Count();

       }

       if (tlHeight < MINIMUM_TIMELINE_HEIGHT)

       {

       tlHeight = MINIMUM_TIMELINE_HEIGHT;

       PlotCanvas.Height = _itemsSource ==null?0: MINIMUM_TIMELINE
How an individual TimeLine visualizes it's data:
        void VisualizeItemsSource()

     {

         //make sure we have all the values needed, before attempting to visualize

         if (_TimeLineEnd != null && _TimeLineStart != null && _ItemsSource != null)

         {

             //Width of the event: (event-length / timeline-length) * width of root canvas

             double w = (_ItemsSource.End - _ItemsSource.Start).TotalDays / (_TimeLineEnd.Value - _TimeLineStart.Value).TotalDays * RootCanvas.ActualWidth;

             TimeLineBorder.Width = (w > 0) ? w : 0;
TimeLineBorder.Height = (RootCanvas.ActualHeight > 3) ? RootCanvas.ActualHeight - 3 : RootCanvas.ActualHeight;

             RootCanvas.Background = _ItemsSource.BackGround;

             Canvas.SetTop(TimeLineBorder, 1.5);

             //place where event starts in the timeline: (event-start - timeline-start)/(timeline-end - event-start) * width of root canvas

             double borderLeft = (_ItemsSource.Start - _TimeLineStart.Value).TotalDays / (_TimeLineEnd.Value - _TimeLineStart.Value).TotalDays * RootCanvas.ActualWidth;

             Canvas.SetLeft(TimeLineBorder, borderLeft);


             //line at bottom of timeline, to separate it from next one.

             Canvas.SetTop(BottomBorderLine, RootCanvas.ActualHeight - 0.1);

             BottomBorderLine.X2 = RootCanvas.ActualWidth;


             //write out the label and tooltip

             TimeLineTextBlock.Text = _ItemsSource.Label;

             Canvas.SetTop(TimeLineTextBlock, 2);

             double textBlockLeft = borderLeft + 4;

             if (textBlockLeft < 0)

                 textBlockLeft = 2;

             Canvas.SetLeft(TimeLineTextBlock, textBlockLeft);

             textBlockLeft = borderLeft + 5;

             if (textBlockLeft < 0)

                 textBlockLeft = 3;

             ToolTipService.SetToolTip(TimeLineBorder, _ItemsSource.ToolTip);

             ToolTipService.SetToolTip(TimeLineTextBlock, _ItemsSource.ToolTip);

             RootCanvas.UpdateLayout();

         }

     }
Here is the method that perform the painful details of drawing the axis:
        private void DrawAxis()

      {

//Clear all existing elements in axis canvas

      AxisCanvas.Children.Clear();

//number of days in the range. Includes partial days.

      double numDays = (_endDate.Value - _startDate.Value).TotalDays;

      double totalWidth = PlotCanvas.ActualWidth;

//Set the axis to span the whole plot canvas

      AxisLine.X2 = totalWidth;

      AxisCanvas.Children.Add(AxisLine);

//Get the Width of a day as represented in the axis. This value wil be used to compute

//the date/time info represented by a point on the plot canvas until the next time axis changes

      _widthOfADay = totalWidth / numDays;

      _mouseHighlight.Width = _widthOfADay;

      _mouseHighlight.Height = PlotCanvas.Height;

      Canvas.SetLeft(_mouseHighlight, 0 - _widthOfADay);

      PlotCanvas.Children.Add(_mouseHighlight);

//The first day may be a partial day. If it is, account for this on the axis.

//axisOffset represents the part of the day before the axis starts

      _axisOffset = (_startDate.Value.TimeOfDay - _startDate.Value.Date.TimeOfDay).TotalDays * _widthOfADay;

      for (double i = 0; i <= numDays; i++)

      {

//day we are dealing with

      DateTime currentDate = _startDate.Value.AddDays(i);

//'left' is the point on the axis that represents the start of the day

      double left = _widthOfADay * i - _axisOffset;

//draw the vertical hash on axis

      var l = new Line { Y2 = 10, StrokeThickness = 0.1,

      Stroke = new SolidColorBrush { Color = Colors.Black } };

      Canvas.SetLeft( l, left);

      Canvas.SetTop(l, 40);

      AxisCanvas.Children.Add(l);

//Date and DayOfWeek are written on the axis if the width of a day is more than 20

      if (_widthOfADay > 20)

      {

//Write date on the axis, starting 3 units from center of the day width

      var t = new TextBlock { Text = currentDate.Day.ToString(), FontSize = 9, FontWeight = FontWeights.Thin, Foreground = new SolidColorBrush { Color = Colors.Gray } };

      Canvas.SetLeft(t, left + _widthOfADay / 2 - 3);

      Canvas.SetTop(t, 30);

      AxisCanvas.Children.Add(t);

//Write dayOfWeek on the axis, starting 3 units from center of the day width

      var d = new TextBlock { Text = currentDate.DayOfWeek.ToString().Substring(0,3), FontSize = 9, FontWeight = FontWeights.Medium, Foreground = new SolidColorBrush{Color=Colors.LightGray } };

      Canvas.SetLeft(d, left + _widthOfADay / 2 - 8);

      Canvas.SetTop(d, 15);

      AxisCanvas.Children.Add(d);

      }

//if it is the first day of the month or the second day on the axis (because the first day may be

//a partial and hence we won't see the value), write the month on the axis

      if (i == 1 || currentDate.Day == 1)

      {

      var tmonth = new TextBlock { Text = Enum.GetName(typeof(Months), currentDate.Month - 1), FontSize = 10, FontWeight = FontWeights.Bold, Foreground = new SolidColorBrush { Color = Colors.Gray } };

      if (currentDate.Month == 1)

      tmonth.Text += " " + currentDate.Year;

      Canvas.SetLeft(tmonth, left);

      Canvas.SetTop(tmonth, 2);

      AxisCanvas.Children.Add(tmonth);

      }

//Draw the vertical gridline on the plot canvas for the start of the day.

      DrawGridLine(left);

//If the day is today, do some special stuff

      if  (currentDate.Date == DateTime.Now.Date)

      {

//color the day in plot canvas

      ColorColumn(left, _widthOfADay, (Brush)Application.Current.Resources["TimeLineTodayColumn"]);

//Draw a colored rectangle on the axis that spans the entire day

      var r = new Rectangle

      {

      Height = AxisCanvas.ActualHeight,

      Width = _widthOfADay,

      Fill = new SolidColorBrush { Color = Colors.Gray },

      Opacity = .1

      };

      Canvas.SetLeft(r, left);

      ToolTipService.SetToolTip(r, "Today");

      AxisCanvas.Children.Add(r);

      }

//if it is weekend and not today, color it differently.

      else if (currentDate.DayOfWeek == DayOfWeek.Sunday || currentDate.DayOfWeek == DayOfWeek.Saturday)

      ColorColumn(left, _widthOfADay, (Brush)Application.Current.Resources["TimeLineWeekendColumn"]);

      }

      AxisCanvas.UpdateLayout();

      }
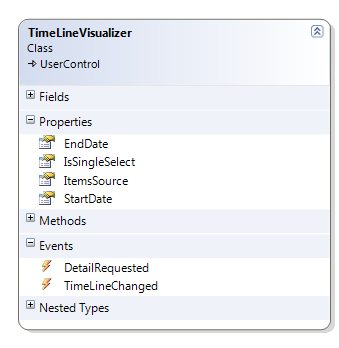
Selection / deselection are done by the TimeLine controls. Global deselection of timelines happens when user double-clicks outside a timeline. The timeline raises a GlobalDeselectRequested event, that gets handled by the visualizer. When a double-click happens inside a TimeLine, it raises an event, that causes the visualize to bundle up the datacontexts of all the selected timelines and pass them through in a DetailRequested event. This can be handled by the instatiating page, and do whatever it needs to do with the info.

 Here is the code-behind in the page that deals with TimeLineVisualizer events: